
Methodology

The Railroad Commission of Texas (RRC) regulates the oil and gas industry across Texas and publishes extensive records. Those records are spread across many separate databases and file formats, which makes it difficult to assemble a clear picture of any single well or area. We have gathered those records into one mapping dashboard with the information most relevant to landowners and communities.
We also interpreted and applied RRC information to estimate what it would cost to plug and clean up these wells.
This Methodology explains where our data comes from, how we organized and analyzed it, and how it is presented in the interactive dashboard.
This site is built and maintained by Purvis Energy Advisors, a petroleum engineering consulting firm based in Fort Worth, Texas. Purvis gathers the RRC data, manages the underlying database, and continues to update the information presented here.
Overview
Reconciliation with other estimates
Why our numbers might look different from others you’ve seen
Our figures reflect our attempts to reconcile multiple sources—some with inconsistent dates and/or data—and to show the information we deem most accurate and relevant. A full description of our methodology follows below, but the headline numbers may not match exactly numbers reported elsewhere. This section summarizes why and how our numbers might be a different than other sources.
-
Our count of orphaned wells may be lower than the last official list because we reconcile the two data sources by excluding wells that have been plugged since the last published backlog of orphans. The RRC’s backlog of unplugged orphaned wells is updated at most once a month and sometimes not for several months. However, its list of all wells in the state includes well status and is updated every month and at a different time in the month. Our count excludes wells subsequently shown in the statewide inventory to have been plugged.
-
Our figure for inactive wells runs similarly lower than other sources because we exclude orphaned wells and exclude wells inactive for less than 12 months. Still-unplugged orphaned wells are sometimes counted as a subset of inactive wells, as in the RRC’s Inactive Well Aging Report which shows a higher number. The RRC’s Well Distribution Tables shows a significantly higher number of inactive wells because it also includes wells inactive for less than 12 months. This report by the RRC often shows 150,000 to 160,000 inactive wells in each month.
-
Our estimate runs higher than costs generally reported; most reporting on costs seems to include only part of the costs. Our estimate includes the full scope of necessary costs: downhole plugging costs PLUS surface removal and remediation costs PLUS the internal administrative and supervisory costs borne by the RRC. In addition, our cost estimates are measured and applied by district, the highest resolution data available. When figures of approximately $50,000 per well are quoted, the number represents a statewide sample and seems not to include surface or administrative costs which are measured and reported separately.
-
Our total runs higher than other mainly because, by averaging over a full year, our count includes wells that have been shut in for less than the 12 months.
While others have reported 60,000 to 70,000 wells in this category of extremely low production, our estimate of submarginal wells runs higher than other published estimates because we take a broader view in two regards. Because this category is meant to count wells creating little or no production or cash flow compared to the end-of-life cost, we calculate the average rate as the lease production over 12 months averaged over the number of unplugged well on the lease (excluding inactive and orphaned). Rather than counting production allocated in individual months by a third party, our method represents production over a longer period and includes all wells associated with a lease. Our count thus includes many wells with intermittent production; most of the approximately 50,000 wells shown by the RRC as inactive for less than 12 months likely fall into our more generous “submarginal” category. We also include wells directly associated with producing leases which are not themselves intended for production as the cost of plugging and cleaning up these wells is likely tied directly to the production on the lease.
-
Our count of active wells does include submarginal wells and service wells (such as commercial injection or storage wells) not classified as inactive or plugged by the RRC, but it does not include wells without location data or wells which appear to be duplicates. We do not separate report other wells producing less than 15 BOE/d which are traditionally classified as “marginal” producers. The work of others show that this is the largest category of wells, including nearly 200,000 wells. The number of producing wells in the state which are NOT classified as economically marginal for regulatory purposes represent a minority of the wells in the state.
Following are greater detail and sources for our calculations.
Schematic of data Sources and Calculations

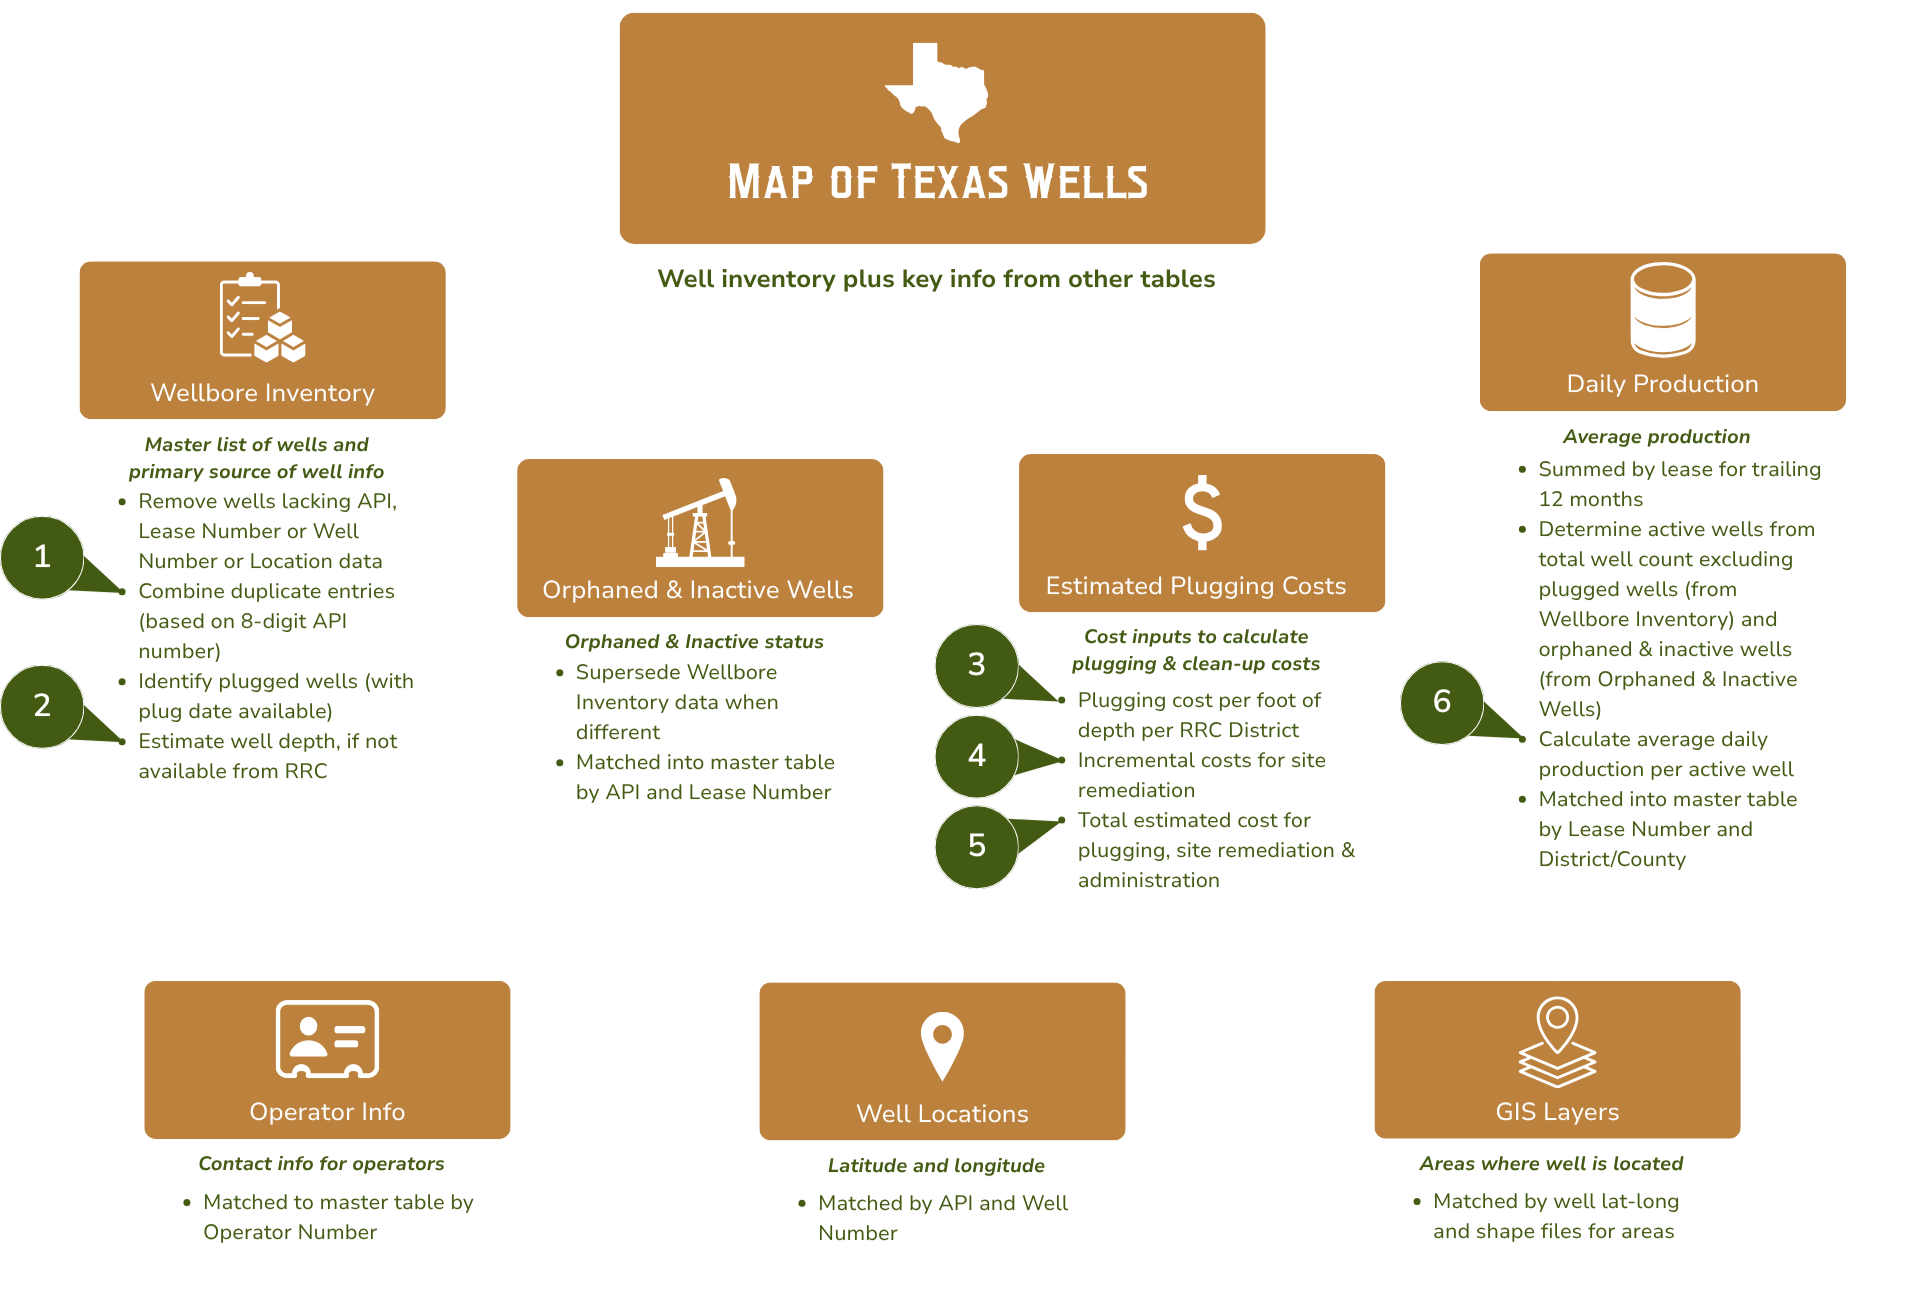
The above Data Sources Schematic shows how the information is handled, analyzed, and combined into the single master map and table available on the homepage. In each rectangle, the orange header identifies the type of the data sourced. The italic text in the white box explains its core utility, and the bullet list offers more detail about the analysis and join of the data.
-
When the RRC’s Wellbore Inventory appears to contain duplicate entries (such as multiple completions in the same wellbore or formatting errors), we combine these into a single line for each wellhead location, so our estimates do not count a single well location multiple times.
We match the wellbores based on a combination of API + Lease Number + Well Number.
For the most recent RRC Wellbore Inventory report, our process removed roughly 470,000 duplicate entries.
-
When a well depth is not available directly from the RRC data, we estimate the depth by analogy using 1 of 3 methods in the following order of priority:
1) The average depth of the wells on the same lease by Lease Number and District Number
2) The average depth of the wells in the same County and Field Number
3) If both previous methods are not available, then we apply the statewide average of 6,700 ftDepth data for unplugged wells:
Available from RRC - 82%
Estimated - 18% -
The RRC reports its average plugging cost per foot of depth by RRC District each year. The most recent available is 2025, and we note large reductions in the average cost in some districts (Districts 8, 6, 4, 3) compared to previous years.
We apply the reported RRC District average cost per foot to the well depth (reported or estimated, as described above) to determine the estimated plugging cost. Example: RRC District 2 Average = $9.16/foot of well depth x 6,700’ well depth = $61,372 plugging estimate
-
For site remediation, the RRC does not report a metric which we can apply directly to a wellsite. Instead, it reports the number of operations and the total cost. We estimate an average uplift by district over the RRC reported costs of plugging from the fiscal years 2022 to 2025.
Example: RRC District 2 Average for site remediation = 8% x $61,372 (from 3 above) = $4,909 site remediation estimate.
Specifically, Districts 8 and 10 are 7%, Districts 1 and 2 are 8%, District 4 is 17%, Districts 7B and 7C are 20% and 21%, District 9 is 33%, District 3 is 50%, District 8A is 104%, and Districts 5, 6 and 6E are 134%.
-
Plugging & site remediation involves several steps in the field: plugging of the wellbore below the surface, removal of surface equipment, flowlines and materials, remediation of surface pollution, and sometimes restoration of the surface.
The RRC reports its out-of-pocket costs paid to contractors in two parts: “plugging” which includes downhole operations plus some surface clean-up, and “site remediation” for more extensive work at the surface. In its annual reports, the RRC also reports its internal costs of executing the program.
We relied upon the RRC’s annual accounting of its internal costs from 2019 to 2025 to estimate that its future administrative costs will be 18% of its out-of-pocket costs paid to contractors for plugging and surface clean-up.
Formula: (Plugging cost estimate + site remediation estimate) x 18% administration estimate = total estimated cost
Example: $61,372 (from 3 above) + $4,909(from 4 above) + $11,046 (18% administration) = $77,327 total estimated cost
-
We determine the number of “active” wells by counting the wells (in the normalized Wellbore Inventory) then subtracting the number of plugged wells (with a reported plug date in the normalized Wellbore Inventory), the number of orphaned wells (from the Orphaned Wells list), and the number of other inactive wells (from the Inactive Wells list).
However, production data is not reported by individual well but by Lease ID. Oil leases can contain multiple wells. Our calculation of lease production includes service wells like injectors, so the average production available to pay for clean-up is spread across the wells actively involved in creating that production. Due to evident inconsistencies in separate reports from the RRC, we set the minimum number of wells to one.
To calculate the production, we use the number of days in the year so the figure represents the average rate actually achieved over the year, including downtime, rather than what the lease may be capable of producing.
Production of oil and gas are combined by revenue equivalence into “barrels of oil equivalent” (BOE) using 6 Mcf (thousand cubic feet) of natural gas equivalent to 1 barrel of oil.
-
The rule affects only wells meeting both of two criteria: shut-in more than 15 years ago AND completed more than 25 years ago.
We determine whether or not a well is affected by the current rulemaking using completion and shut-in dates reported on the RRC Inactive Well Aging Report. We do not attempt to estimate dates for the minority of wells not already evaluated by the RRC.
When both dates are available we calculate the difference between the date of our calculation and the reported dates and divide by 365.24 days in a year. If only the shut-in date is available, then wells shut in for more than 25 years are deemed affected. Other wells shut-in from 15 to 25 years do not have enough information to evaluate.
Sources for Map of Texas Wells
Data sources, report names, fields used, and update frequency.
| TABLE | SOURCE, UPDATE FREQUENCY | SOURCE REPORT | REPORT DATE | DATA USED | LINK | NOTES |
|---|---|---|---|---|---|---|
| Wellbore Inventory | Texas Railroad Commission, updated monthly | "OG Wellbore Report" aka "Wellbore Query Data" | 9/2/2026 | District, County, API, Lease Number, Lease Name, Field Name, Field Number, Well Number, Depth, Shut-in Date, Plug Date, Completion Date, P-5 Renewal Year and Month | RRC | Master list of wells plugged and needing to be plugged, contains other key info about wells |
| Well Locations | Texas Railroad Commission, updated twice weekly | "Well Layers by County" | 10/6/2026 | Latitude and longitude by well, Lease Number, Well Number | RRC | Source of well locations |
| Orphaned Wells | Texas Railroad Commission, updated monthly, timing varies | "Orphan Wells with Delinquent P-5 Greater Than 12 Months" | 10/1/2026 | API, Well Name, Latitude, Longitude, Lease ID, Operator Name, Operator ID, County, Months P-5 Inactive | RRC | List of officially orphaned wells |
| Inactive Wells | Texas Railroad Commission, updated monthly, timing varies | "Inactive Well Aging Report" | 10/6/2026 | API, Well Name, Latitude, Longitude, Lease ID, Operator Name, Operator ID, County, True Vertical Depth, Plugging Cost Estimate | RRC | List of officially inactive wells |
| Monthly Production | Texas Railroad Commission, updated monthly | "Production Data Query Dump" | 4/2/2026 | API, Well Name, Latitude, Longitude, Lease ID, Operator Name, Operator ID, County, True Vertical Depth, Production history | RRC | Used to determine production status of wells not orphaned or inactive |
| Operator Info | Texas Railroad Commission, updated monthly | "Oil & Gas Directory" | 8/26/2026 | Operator mailing address, phone, and P-5 status | RRC | Contact info for operators |
| Plugging Cost Estimates | Texas Railroad Commission, updated annually | "Cost Calculation: Plugging Cost Estimate" | 9/9/2026 | Average per-foot plugging cost by District and by Fiscal Year | RRC | Basis of plugging cost estimate (combined with well depth) |
Sources for Regional Data
Supporting data sources and links for Map of Texas Wells
| GIS DATA | GIS DATA SOURCE | LINK | NOTES |
|---|---|---|---|
| Base Map | PowerBI | ESRI | Integrated to Power BI interface |
| City Limits | Texas Department of Transportation (TxDOT) | Texas City Boundaries - Overview | City name |
| County Boundaries | Texas Department of Transportation (TxDOT) | Texas County Boundaries - Overview | (only shown on map, not joined to data) |
| Major Aquifers | Texas Water Development Board | GIS Data | Texas Water Development Board | (only shown on map, not joined to data) |
| Water Conservation Districts | Texas Commission of Environmental Quality (TCEQ) | TCEQ Groundwater Conservation Districts - Overview | Water district name |
| Schools | Texas Education Agency | TEA - Schools | (only shown on map, not joined to data) |
| School Districts | Texas Education Agency | TEA - School Districts | School district name |
| TX Senate | Texas Department of Transportation (TxDOT) | Texas State Senate Districts - Overview | District number, Official name |
| TX House | Texas Department of Transportation (TxDOT) | Texas State House Districts - Overview | District number, Official name |
| US House | Texas Department of Transportation (TxDOT) | Texas US House Districts - Overview | District number, Official name |